scVelo Analysis
Introduction
TIP
scVelo is a single-cell trajectory inference tool based on the concept of RNA Velocity. It predicts the future transcriptional state of individual cells by analyzing the ratio of nascent (unspliced) and mature (spliced) mRNA, thereby revealing the direction and rate of cellular dynamic processes. Compared to traditional pseudotime analysis, scVelo provides more biologically meaningful vector information, enabling direct inference of cell fate trajectories.
In single-cell research, understanding the dynamic regulation of cell state transitions is one of the core challenges. Traditional trajectory inference methods typically sort cells based on transcriptional similarity but cannot clearly indicate the direction of transitions. By introducing the concept of "RNA Velocity," scVelo ingeniously leverages temporal information in the gene transcription process to create a "vector field map" of cell state changes, allowing us to predict which direction cells will differentiate or transition in the near future.
Core Functions of scVelo
- RNA Velocity Calculation: Estimates the transcriptional dynamic rate of each gene in each cell based on spliced and unspliced read counts.
- Cell Trajectory Inference: Embeds RNA velocity into low-dimensional space (such as UMAP) and visualizes the vector field of cell state transitions in the form of a Streamline Plot.
- Driver Gene Identification: Identifies velocity genes that play key regulatory roles in specific cell lineage transition processes.
- Latent Time Inference: Estimates the time required for a cell to reach a specific state after transcriptional events occur (Latent Time).
This document aims to provide researchers with a detailed scVelo technical guide, covering its core principles, operation methods on the SeekSoul™ Online platform, result interpretation, practical cases, and frequently asked questions, helping you deeply understand and efficiently utilize scVelo for cellular dynamic process research.
Overview of RNA Velocity
What is RNA Velocity
RNA Velocity is the core concept of scVelo analysis. It refers to the rate of change in mRNA abundance of a single gene in a single cell at a specific time point. The biological basis for this concept is the gene transcription process:
- Transcription: Genes are transcribed into pre-mRNA containing introns, corresponding to unspliced reads in sequencing data.
- Splicing: Introns are removed, and exons are joined together to form mature mRNA, corresponding to spliced reads in sequencing data.
- Degradation: Mature mRNA is eventually degraded.
By quantifying the ratio of unspliced to spliced mRNA for a gene in a cell, scVelo can infer whether the gene is upregulated (unspliced > expected steady-state ratio), downregulated (unspliced < expected steady-state ratio), or in a stable state. Integrating velocity information from all genes yields the overall direction of change for the cell at the transcriptome level, known as the "RNA velocity vector."
Advantages of scVelo
TIP
Compared to traditional pseudotime analysis, scVelo has the following significant advantages:
- Directionality: Can directly infer the direction of cell state transitions, solving the problem of determining "start" and "end" points in traditional trajectory analysis.
- Instantaneity: Captures the dynamic change trends of cells at the current moment, rather than sorting based on past states.
- Unsupervised: No need to preset starting cells or differentiation paths, fully data-driven.
- Circular Process Analysis: Better able to identify and analyze cyclic biological processes such as the cell cycle.
Theoretical Basis of scVelo
The theoretical core of scVelo is the dynamic model of RNA Velocity. This model is based on a simple yet powerful biological principle: gene expression is a dynamic process involving three main steps: transcription, splicing, and degradation. By quantifying the abundance of intermediate products (unspliced mRNA) and final products (spliced mRNA) in this process, we can infer the direction and rate of gene expression changes.
Dynamic Transcription Model
scVelo mathematically models the transcriptional dynamics of each gene, with basic equations describing the changes in unspliced (
- Transcription:
- Splicing:
Where:
is the transcription rate of the gene. is the splicing rate from unspliced to spliced. is the degradation rate of spliced mRNA.
In scVelo, the transcription rate
Velocity Calculation
RNA velocity (
This formula is the core of scVelo calculation. It tells us that the velocity of a gene depends on the balance between newly synthesized mRNA (
- When
, velocity is positive, indicating the gene is being upregulated. - When
, velocity is negative, indicating the gene is being downregulated. - When the two are equal, the system is in steady state.
Model Modes
scVelo provides several modes to solve the above equations and infer velocity:
Steady-State Model: This is the foundation of the initial RNA Velocity method. It assumes cells are in transcriptional steady state, where transcription rate
and degradation rate are constant. In this case, there is a linear steady-state ratio between unspliced and spliced mRNA ( ). Velocity is calculated as the residual between observed values and this steady-state line. This model is simple and fast but cannot accurately describe the complete dynamic process of gene upregulation or downregulation. Dynamical Model: This is scVelo's signature improvement. This model relaxes the steady-state assumption, allowing transcription rate
to vary over time, enabling separate modeling of gene upregulation and downregulation phases. It fits transcription rate ( ), splicing rate ( ), and degradation rate ( ) for each gene using the Expectation-Maximization (EM) algorithm, and infers the specific transcriptional state (induction, repression, or steady state) of each cell. This makes velocity estimation more accurate, particularly suitable for describing complex, non-steady-state biological processes.
Velocity Visualization
After calculating the velocity of each gene in each cell, scVelo projects these high-dimensional velocity vectors into familiar low-dimensional spaces (such as UMAP or t-SNE) for visualization.
- Velocity Graph: First, scVelo constructs a "velocity graph," which is an
(N is the number of cells) transition matrix. Each element in the matrix represents the likelihood of cell i transitioning to cell j, calculated based on the cosine similarity between cell i's velocity vector and the directional vector from cell i to cell j. - Streamline Plot: Finally, by averaging or interpolating velocity vectors in low-dimensional space, scVelo generates an intuitive streamline plot. The arrows in the plot clearly show the main flow directions and trajectories of cell populations in transcriptional space, revealing cell differentiation paths and fate decision points.
SeekSoul™ Online Operation Guide
Performing scVelo analysis on the SeekSoul™ Online platform is intuitive and convenient.
Preparation Before Analysis
TIP
scVelo analysis has specific requirements for input files. Before starting the analysis, please ensure:
- Input file is in
loomformat: You need to provide aloomfile containing spliced and unspliced read counts. This is the fundamental basis for calculating RNA velocity. - Data has undergone preprocessing: Data should have completed standard quality control, dimensionality reduction (PCA, UMAP), clustering, and cell type annotation.
- Appropriate cell subsets selected: RNA velocity analysis should be performed in cell subsets with potential dynamic transition relationships to ensure biological significance of results.
Parameter Details
| Interface Parameter | Description |
|---|---|
| Task Name | The name for this analysis task, must start with a letter, and can include letters, numbers, underscores, and Chinese characters. |
| Config | - Sample Column: Sample label. |
- Sample Name: Name of the sample.
- Loom file: Upload the corresponding sample's
loomfile. | | Group.by | Select the label corresponding to the cell type or cluster to be analyzed. For example,CellAnnotation, used in conjunction with "Cell Type". | | Cell Type | Multiple selection, choose the cell types or clustering results to be analyzed, such asMonocyteandMacrophage. | | Note | Custom note information. |
Operation Process
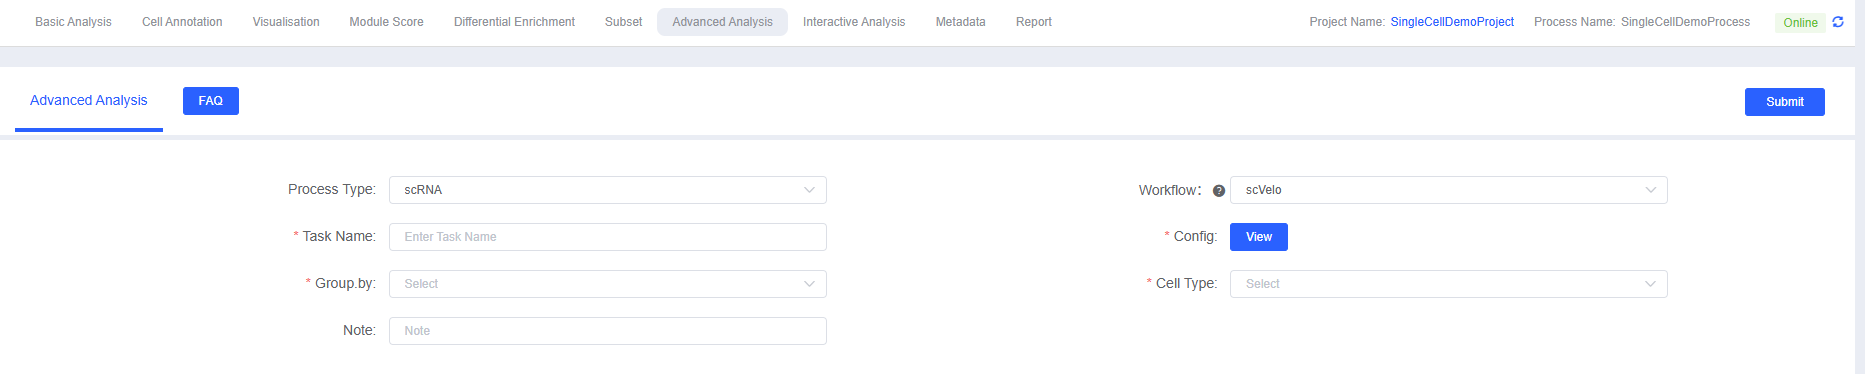
- Enter Analysis Module: Navigate to the "Advanced Analysis" module on the platform and select "scVelo" as the analysis workflow.
- Create New Task: Name your analysis task and upload the
loomfile. - Configure Parameters: According to the above guidelines, select the groups and cell types to be analyzed.
- Submit Task: After confirming parameters are correct, click the "Submit" button and wait for analysis completion.
- Download and View: After analysis completes, download and view the generated analysis report and result files from the task list.
Result Interpretation
The scVelo analysis report provides a series of charts that reveal the dynamic process of cell state transitions from different dimensions. The following is a detailed interpretation of core results.
Spliced/Unspliced RNA Ratio Plot
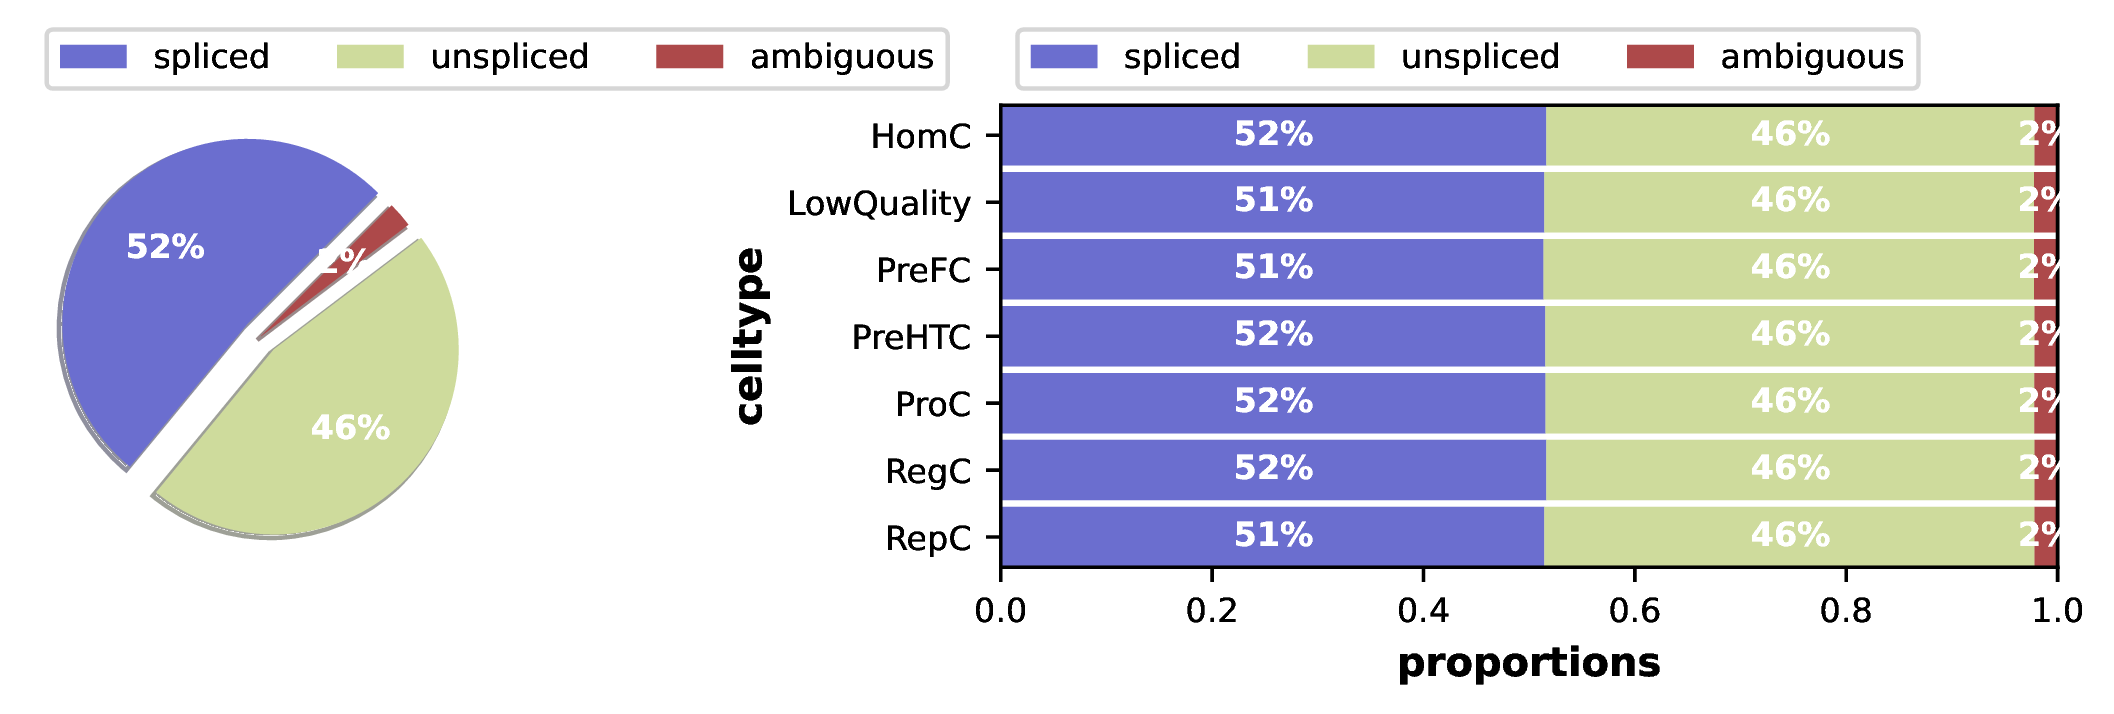
This plot shows the relative abundance of spliced and unspliced RNA in different cell types.
- Key Interpretation Points:
- Left Plot (Overall Ratio): Shows the total count ratio of spliced to unspliced reads across all cells. Typically, unspliced reads accounting for 10%-25% is quite typical, reflecting overall transcription and splicing efficiency.
- Right Plot (By Cell Type): More precisely shows differences in splicing efficiency across each cell subset. Generally, undifferentiated cells or cells in a rapidly proliferating/differentiating state (such as progenitor cells, stem cells) typically have higher transcriptional activity and relatively higher proportions of unspliced RNA. In contrast, mature, functionally stable cells tend to have steady-state transcriptional activity with potentially lower unspliced ratios.
- Quality Control: This plot can be used to check if splicing efficiency is consistent across different cell types. If a subset shows unusually high or low ratios, you may need to check data quality or consider its unique biological characteristics.
Cell Dimensionality Reduction Plot
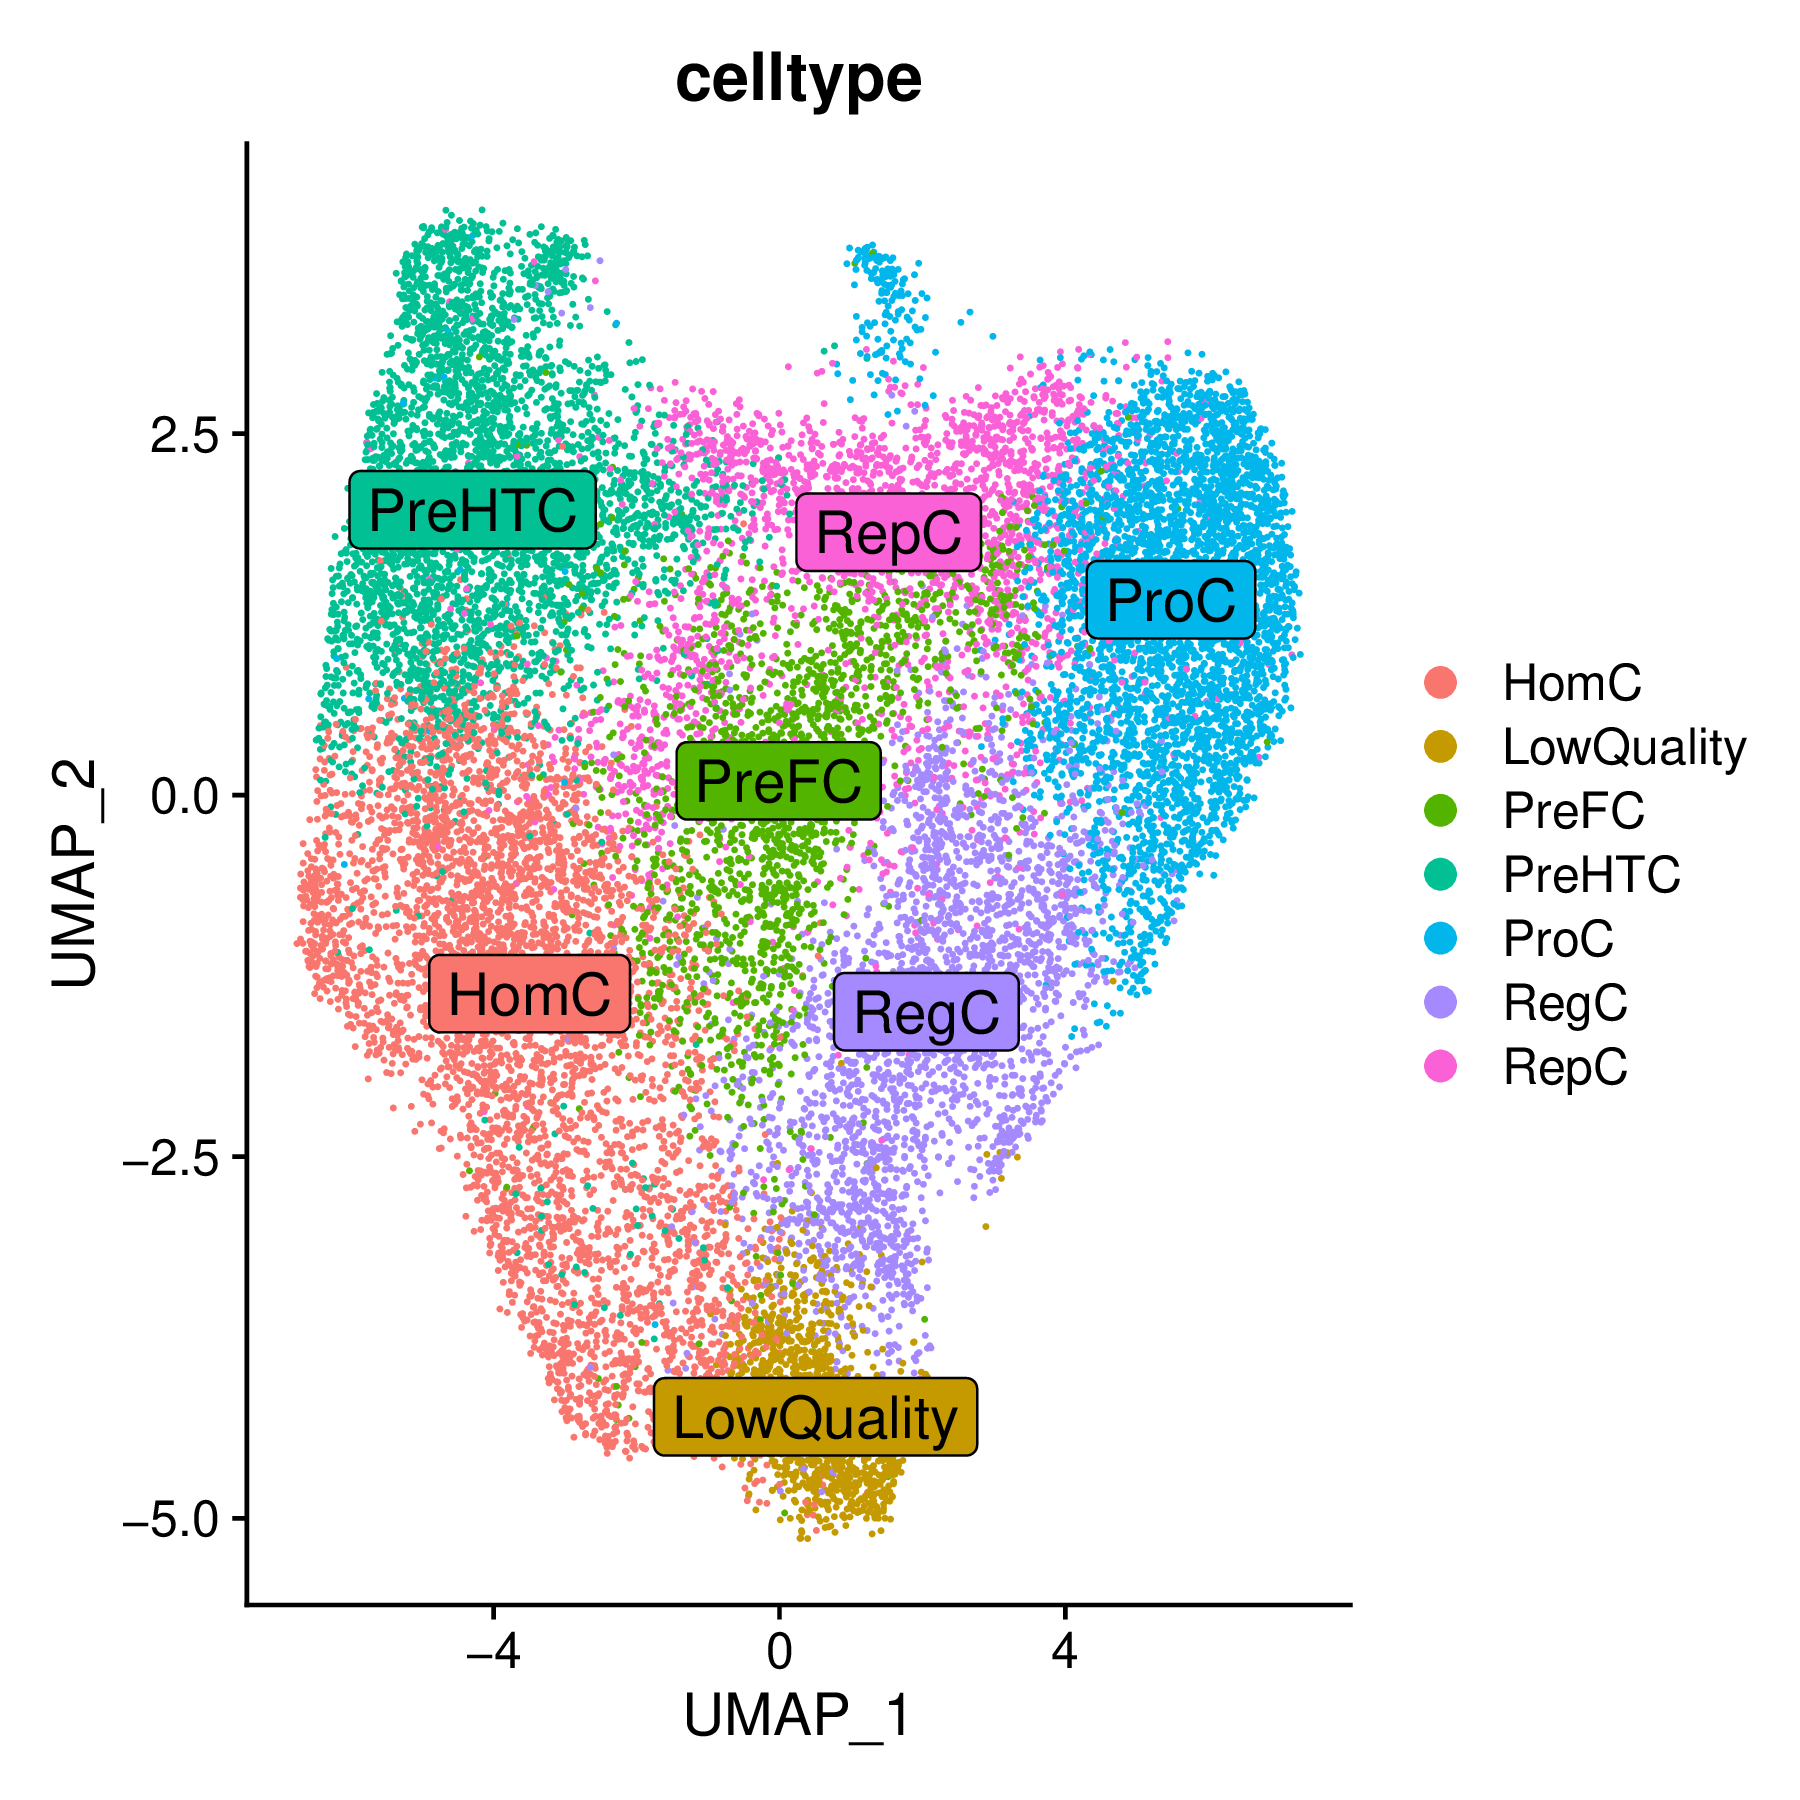
This is a standard UMAP/t-SNE dimensionality reduction plot showing the distribution of various cell subsets involved in the analysis.
- Key Interpretation Points:
- Cell Identity: Each point in the plot represents a cell, with different colors corresponding to different cell types or clusters. This is the foundation for all subsequent velocity analysis and trajectory visualization.
- Spatial Relationships: The proximity of cells in the plot reflects their similarity at the transcriptome level. Typically, cell types with differentiation relationships will be spatially adjacent.
RNA Velocity Differentiation Trajectory Plot
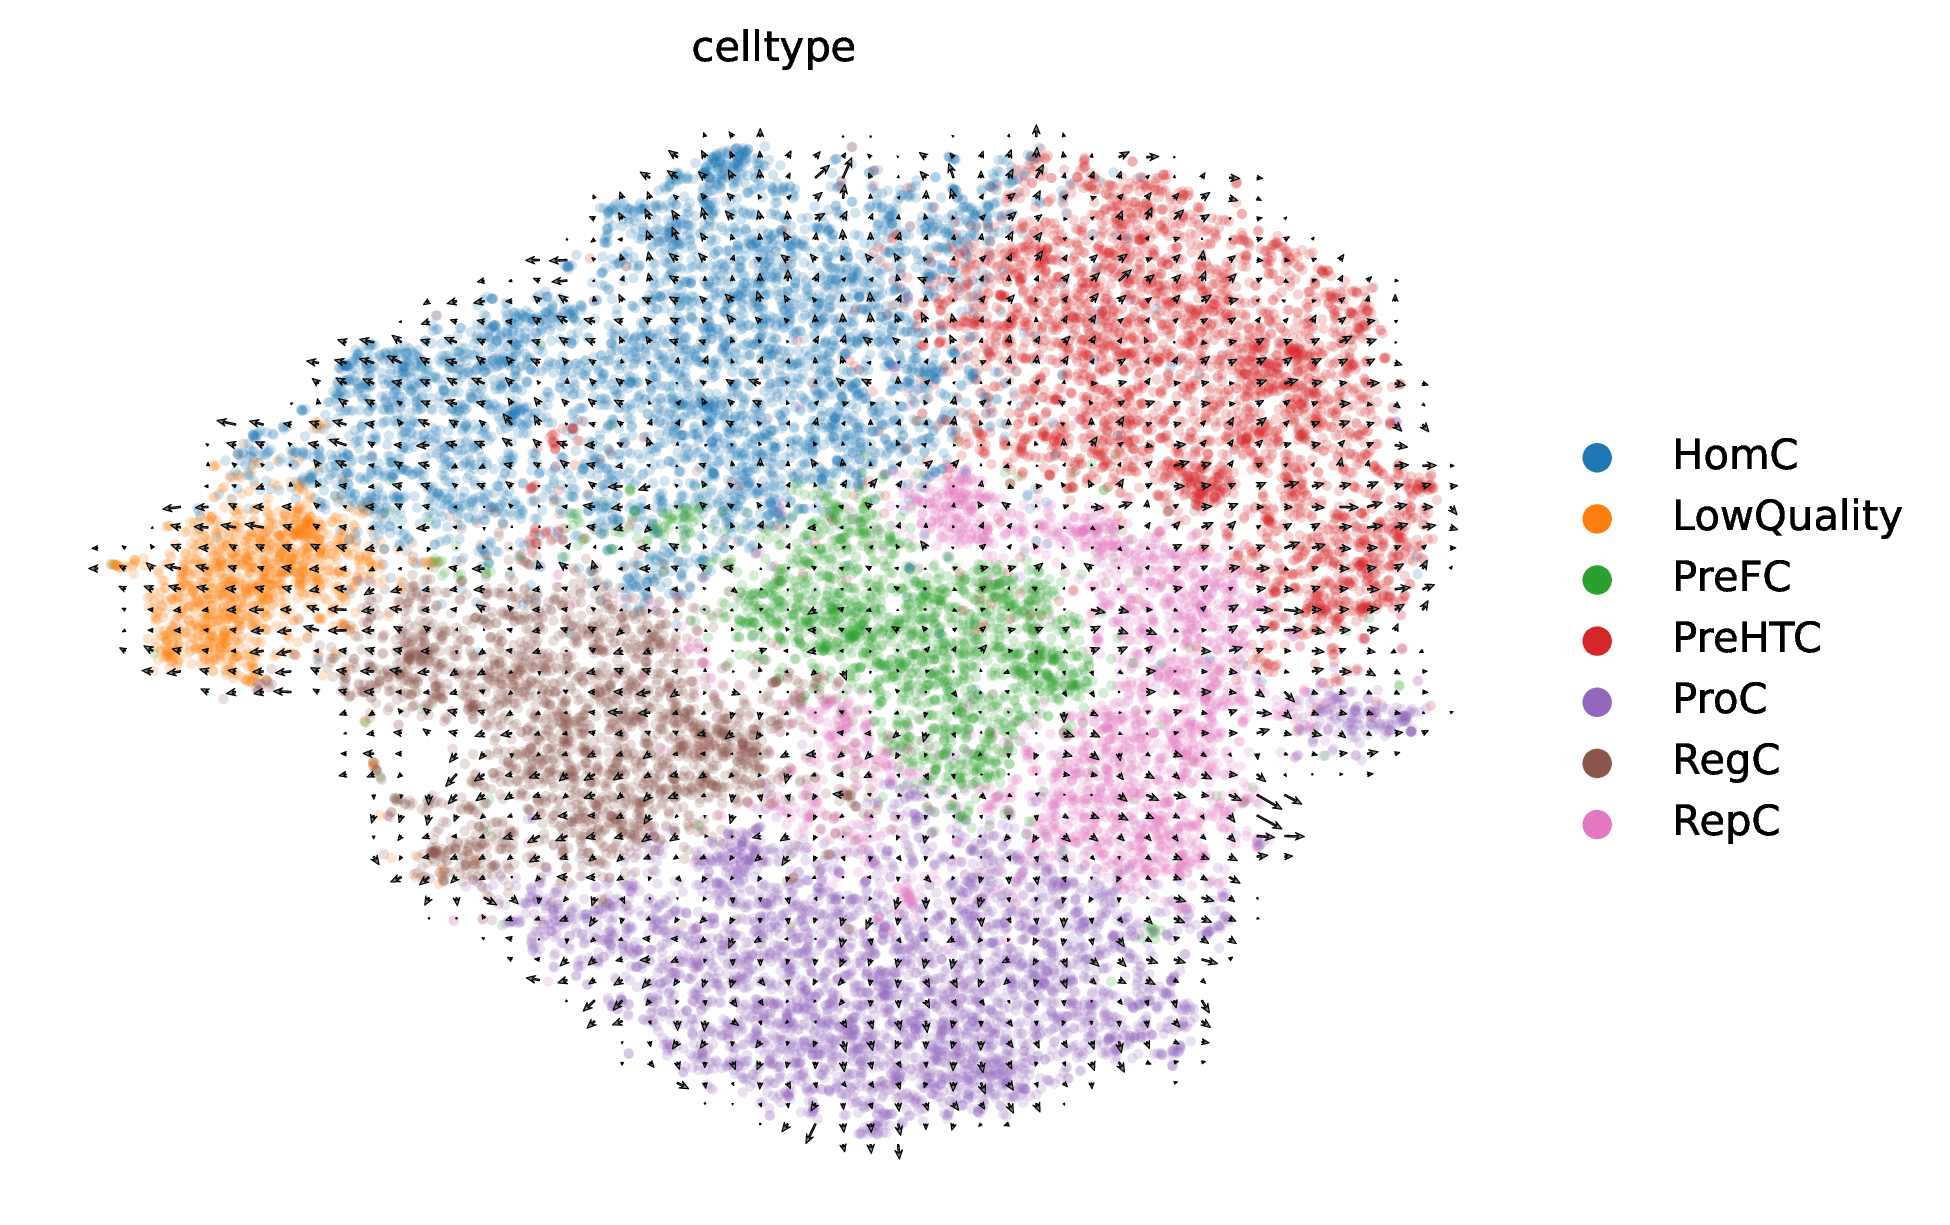
This is the most core result plot of scVelo analysis. It overlays a vector field on the cell dimensionality reduction plot, intuitively showing the direction and trend of cell state transitions in the form of arrows.
- Key Interpretation Points:
- Arrow Direction: Arrows indicate the direction of RNA velocity-predicted "future" states of cells. A continuous arrow flow (Streamline) represents a potential cell differentiation or transition path.
- Trajectory Inference: By observing the flow of arrows, differentiation starting points (typically areas where arrows flow out), intermediate transition states, and endpoints (areas where arrows converge) can be inferred unsupervised. For example, if arrows point from cell type A to cell type B, this indicates the existence of a differentiation trajectory from A to B.
- Cyclic Processes: If arrows form a closed loop, this may indicate cyclic biological processes such as the cell cycle.
Latent Time Plot
Latent Time is an important time metric inferred by scVelo's dynamic model. It represents the position of each cell in its own dynamic change trajectory and can be understood as the cell's "internal biological clock."
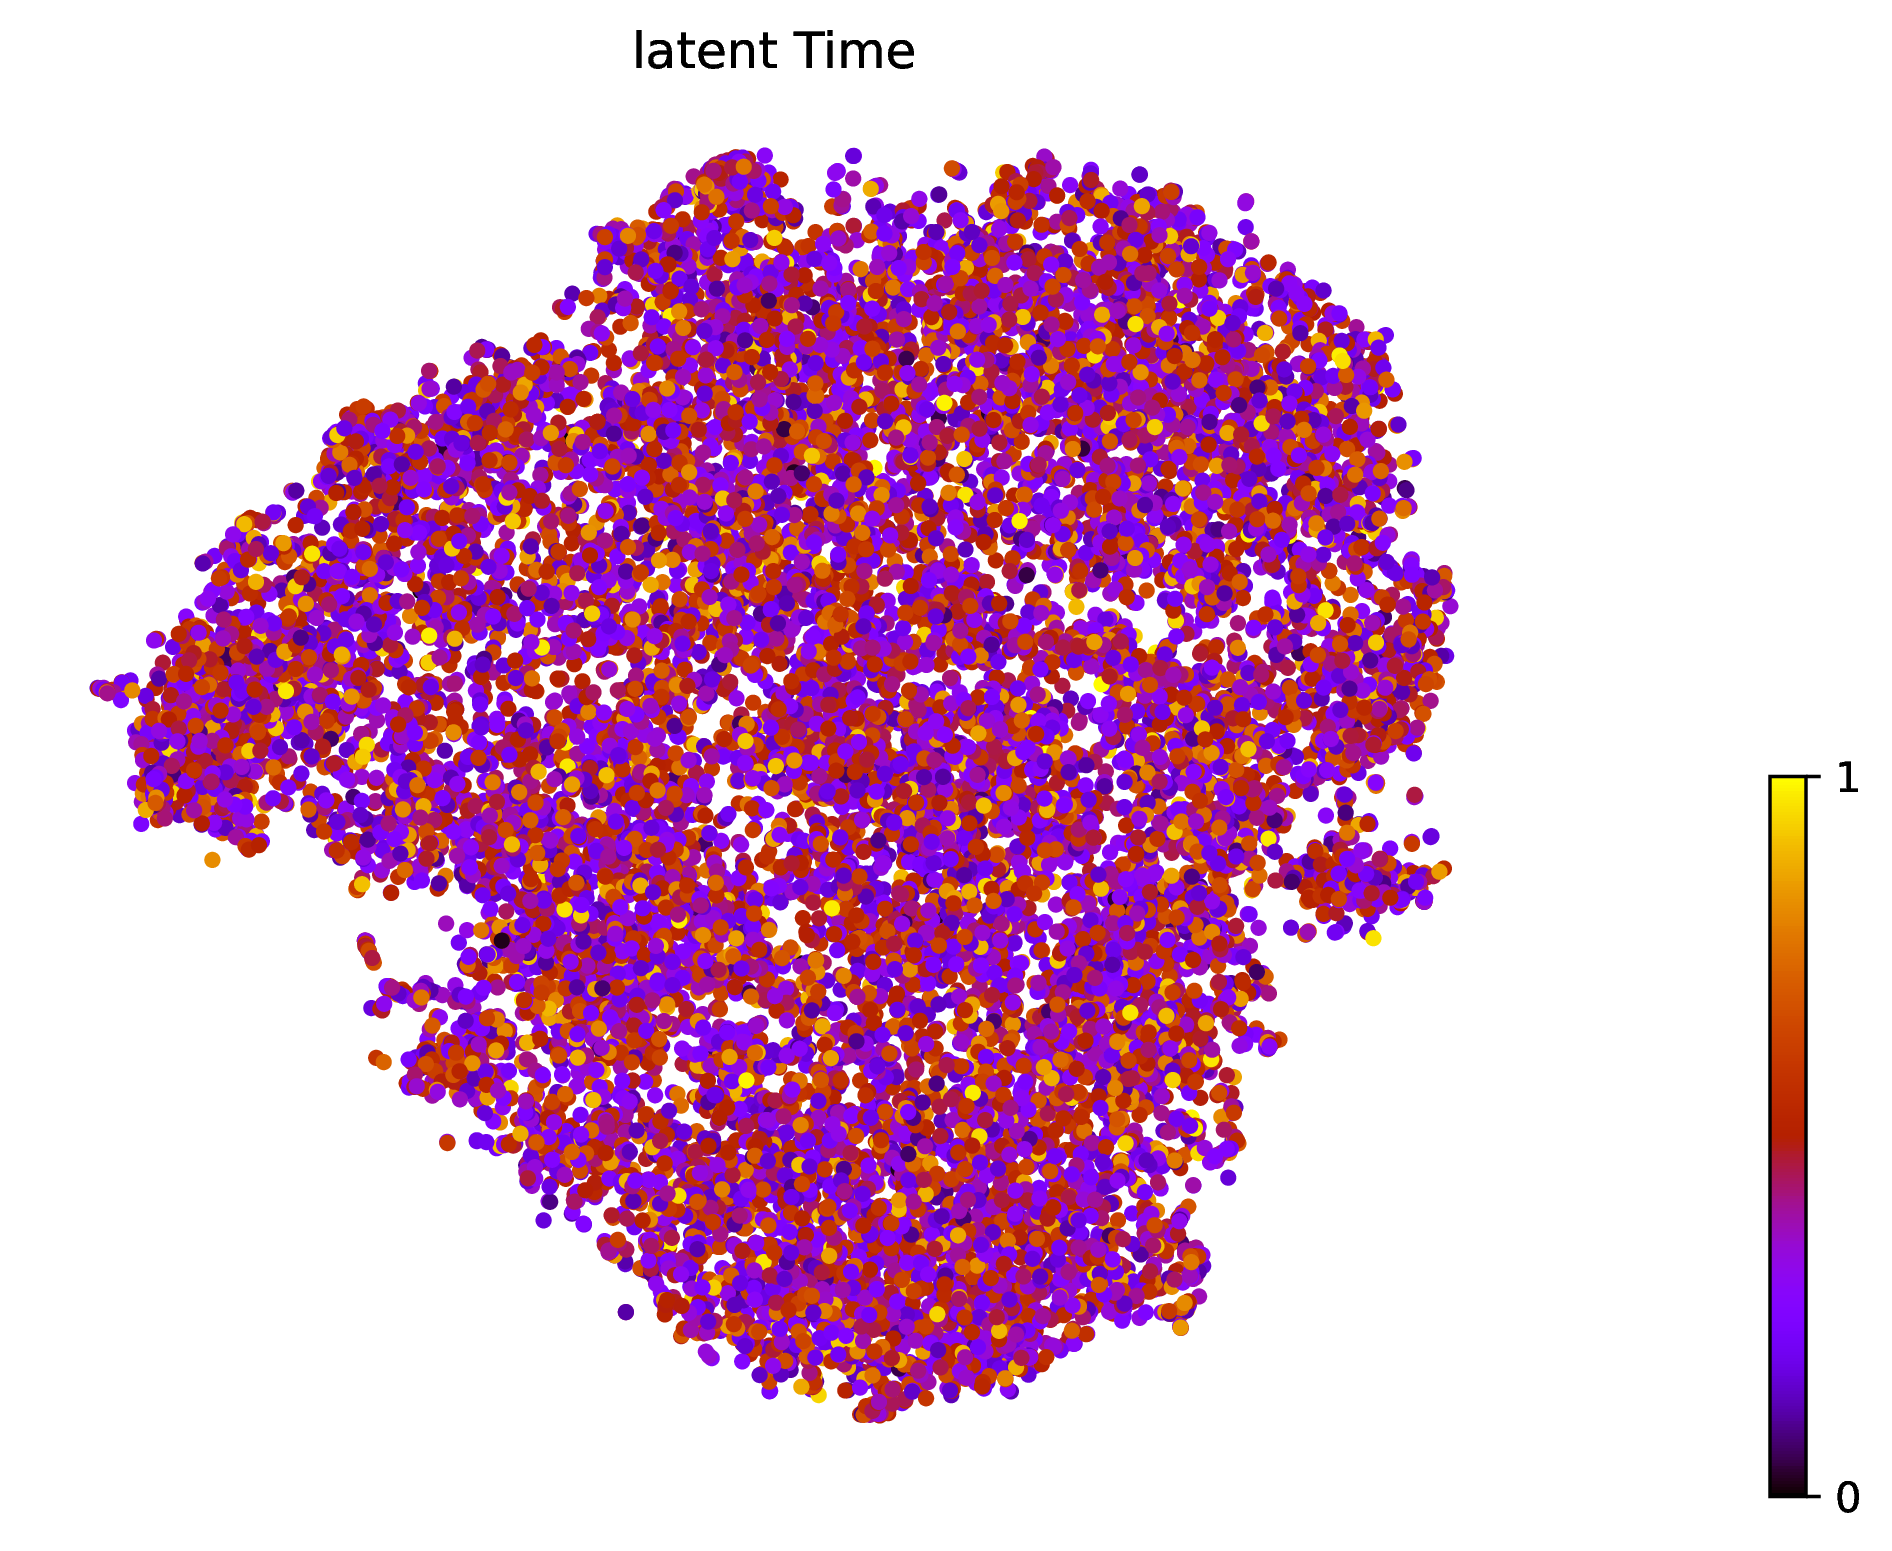
- Key Interpretation Points:
- Color Gradient: The depth of color in the plot (typically from blue to yellow) represents the age of Latent Time. Colors closer to 0 (or cooler) indicate cells are in early or starting states of the differentiation process; colors closer to 1 (or warmer) indicate cells are closer to the differentiation endpoint.
- Trajectory Verification: The distribution trend of Latent Time should be consistent with the trajectory direction inferred from the previous velocity flow plot. For example, along a differentiation path from A to B, the Latent Time of cells should gradually increase. This provides strong evidence for the inferred trajectory.
Top Driver Genes Heatmap
To identify key genes driving cell state transitions, scVelo ranks genes based on their likelihood in the dynamic model. Genes with higher likelihood values have expression dynamics that better fit the model and are more likely to be key regulatory factors driving trajectory changes. This heatmap shows the expression patterns of genes with the highest likelihood rankings (such as Top 300).
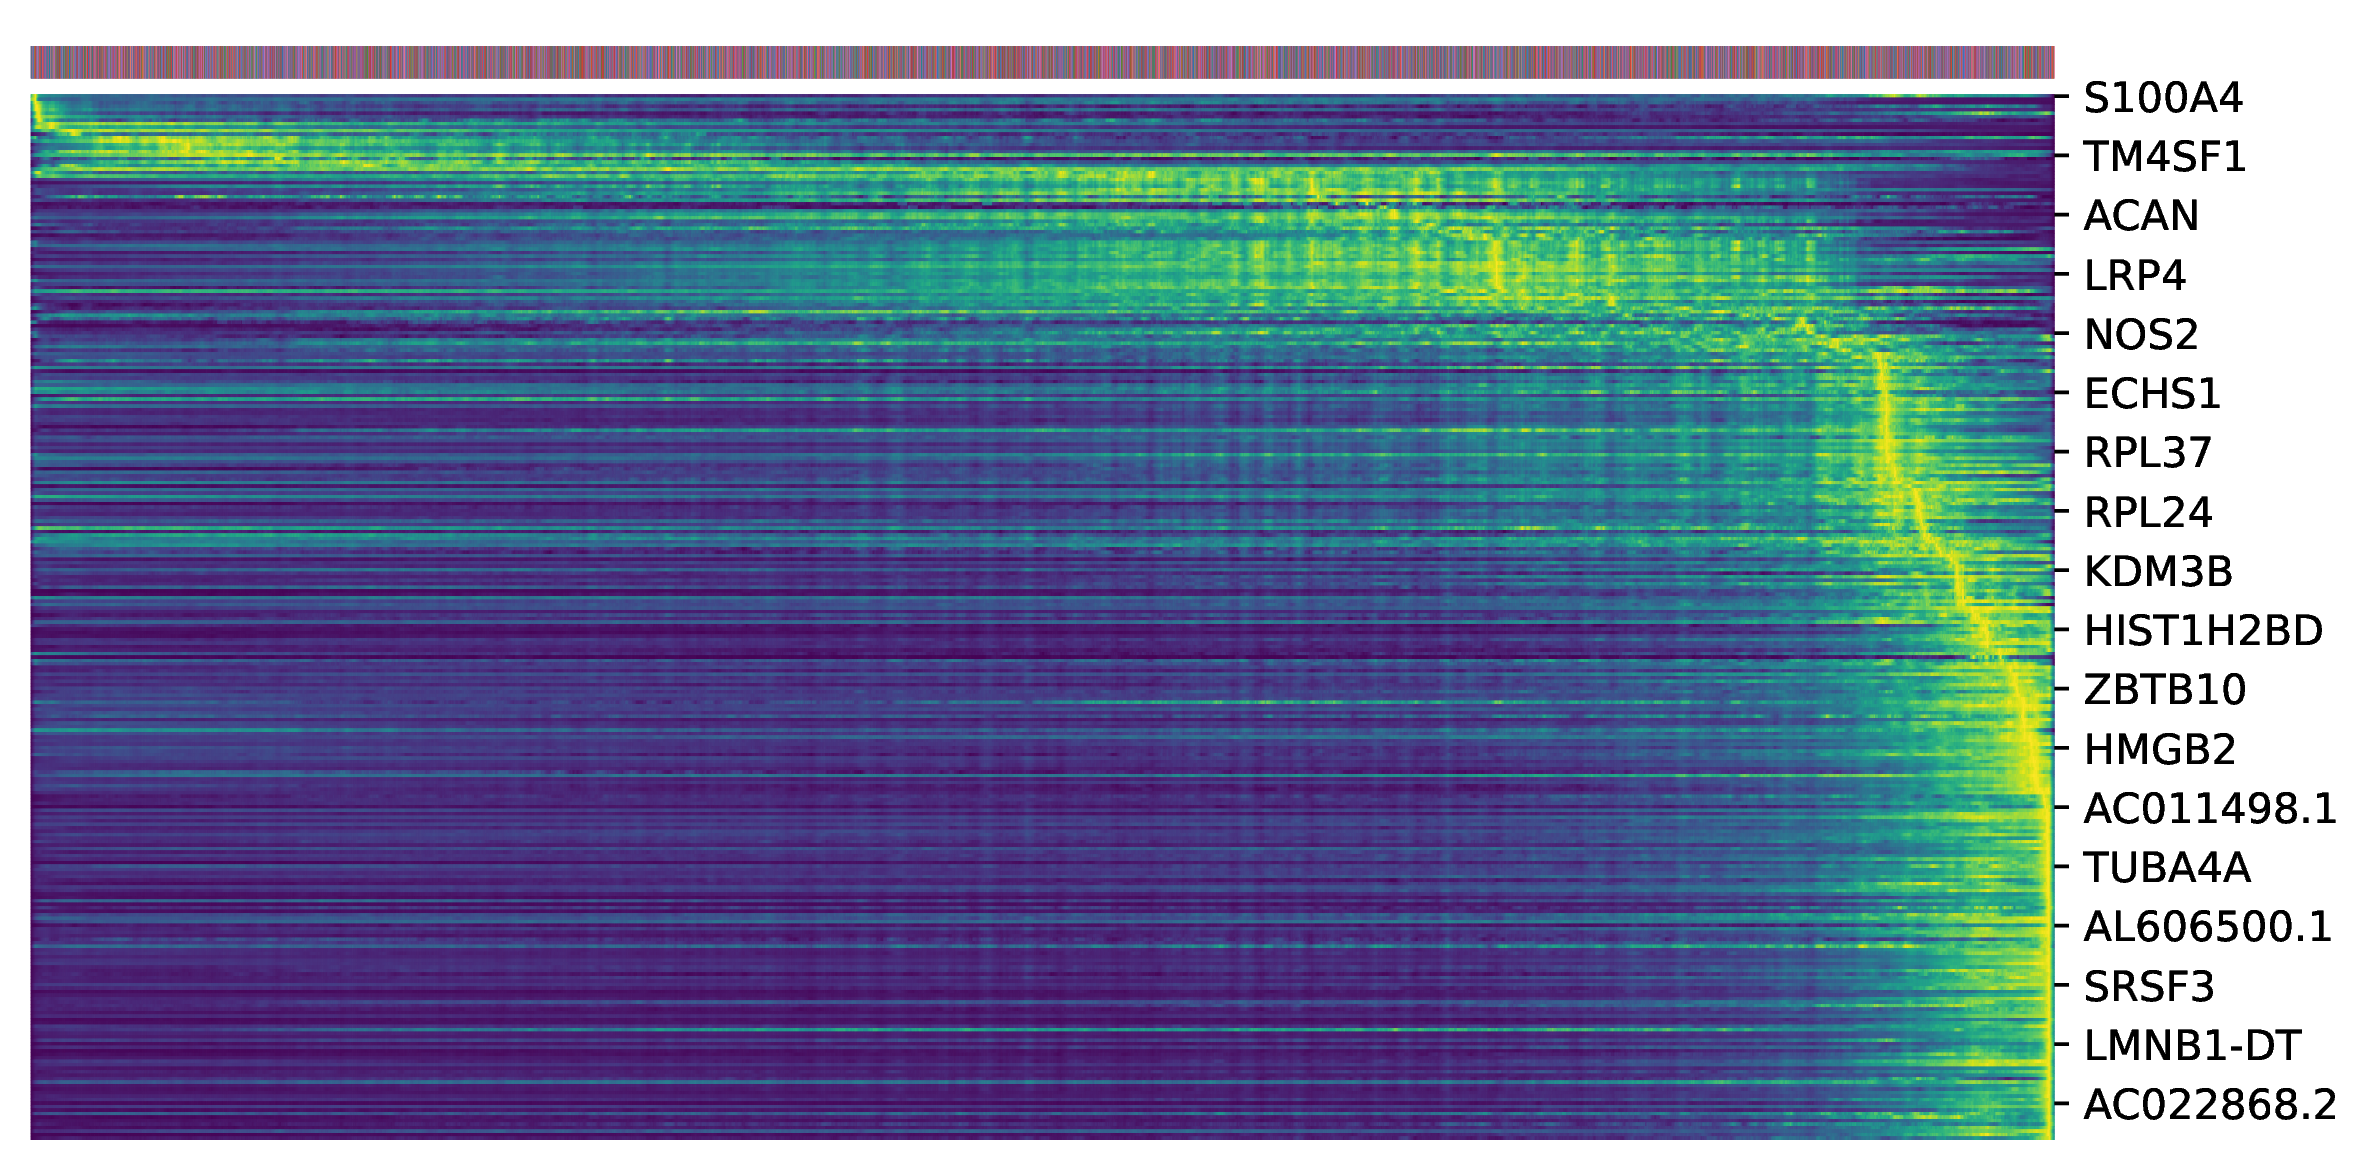
- Key Interpretation Points:
- X-axis: Cells are sorted by their "Latent Time" from early to late.
- Y-axis: Genes ranked highest by likelihood.
- Expression Patterns: By observing gene expression patterns in the heatmap, gene clusters that are specifically highly expressed in early, middle, or late differentiation stages can be identified. These genes likely play key roles in corresponding stages of cell fate determination and are important candidates for subsequent functional verification.
Result File List
| File Name | Description |
|---|---|
scvelo_spliced_unspliced_prop.png | Spliced/Unspliced RNA ratio plot. |
scvelo_*_embedding_grid|stream.png | RNA velocity vector field plot (* represents dimensionality reduction method). |
scvelo_*_latentTime.png | Cell latent time plot. |
scvelo_latentTime_topGenes.png | Top driver genes heatmap. |
scvelo_latentTime_data.csv | Core Data: Latent time values for each cell. |
top_gene_300.csv | Core Genes: List of Top 300 driver genes. |
Application Cases
As a powerful trajectory inference tool, scVelo has been widely applied in numerous research fields. The following are two typical application cases.
Case One: Resolving Mouse Hippocampal Cell Lineages
In a study on mouse hippocampal development, researchers used scVelo to verify and resolve the direction of cell differentiation.
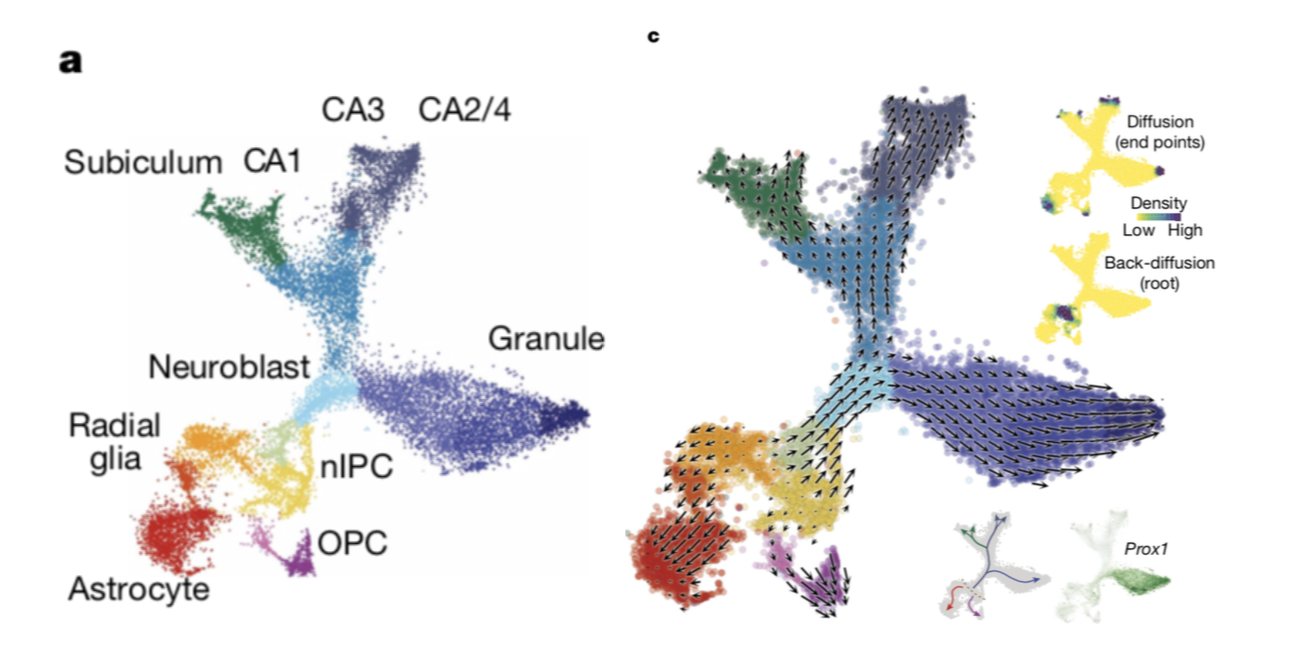
- Background: Through cell clustering and marker gene analysis, researchers initially identified multiple cell subsets including neuroblasts, granule neurons, CA region neurons, and oligodendrocyte precursor cells (OPCs).
- scVelo Application: By running scVelo, the analysis report generated an RNA velocity trajectory plot (Figure c). The arrows in the plot clearly show that cell flow goes from the Neuroblast population to both Granule and CA populations, while another trajectory shows the transformation process from preOPC to OPC.
- Conclusion: The scVelo results not only highly align with cell identity identification results based on marker genes (Figure a) but also establish dynamic, directional connections between these discrete cell subsets, thus verifying and deepening the understanding of hippocampal cell lineage differentiation.
Case Two: Predicting Tissue Development Trajectories
scVelo can predict the overall trajectory of tissues or organs during development based on transcript splicing dynamics.
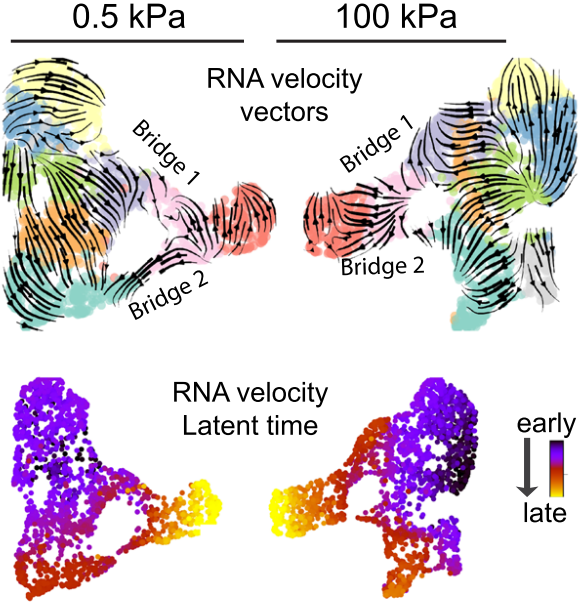
- Background: In complex tissue development processes, multiple cell types differentiate in coordination to form functional structures. Understanding the dynamics and directionality of this process is a core issue in developmental biology.
- scVelo Application: Researchers analyzed developing tissue data using scVelo. The upper figure intuitively shows major cell differentiation paths in the form of arrow flows, while the lower figure depicts the same developmental process from another dimension through inferred Latent Time, with colors changing from cool to warm representing continuous changes from early to late development.
- Conclusion: The two visualization methods mutually confirm, together revealing the continuous trajectory of tissue development and providing a "pseudotime" axis for studying regulatory events at specific time points.
Notes
To ensure the accuracy and reliability of scVelo analysis results, please follow these recommendations:
WARNING
Data Quality is Key
- Loom File Preparation: Ensure the
loomfile used for analysis is generated using standard processes (such asvelocyto), which must contain correctsplicedandunsplicedread counts. Incorrect input will lead to unreliable velocity estimates.
1. Cell Type Selection
- Biological Relevance: The "Cell Types" selected in the platform parameters should have potential biological continuity. Analyzing completely unrelated cell types together (such as T cells and epithelial cells) may produce meaningless trajectories.
- Cell Number: Each cell subset should contain a sufficient number of cells to ensure the robustness of velocity estimation.过于稀少的细胞群可能会导致速度估计不准确。
2. Biological Validation of Results
- Don't Interpret in Isolation: The trajectories provided by scVelo are computational predictions based on transcriptional dynamics. Be sure to validate them against your known biological knowledge, marker gene expression patterns, and results from other pseudotime analysis tools (such as Monocle, PAGA).
- Focus on Driver Genes: The Top driver genes list provided in the report is a valuable clue for finding core regulatory factors. Please focus on these genes and confirm their roles in cell fate determination through literature queries, functional enrichment analysis, or experimental validation.
3. Understanding Model Limitations
- Post-Transcriptional Regulation: The scVelo model is primarily based on transcription and splicing dynamics and cannot capture the impact of post-transcriptional regulatory events such as post-translational modifications or protein degradation on cell states.
- Complex Dynamics: For genes with multiple rates, complex regulatory circuits, or very intense transcriptional bursting, model fitting may have deviations.
4. Visualization Misleading
- Dimensionality Reduction Distortion: All visualizations in two-dimensional space (such as UMAP) have some degree of distortion. The distance between cells in the plot is not completely equivalent to their true transcriptome differences. Therefore, when interpreting trajectories, focus more on the local directionality of arrows rather than their global length or curvature.
Frequently Asked Questions (FAQ)
Q1: Why don't I see obvious arrows or trajectories in my analysis results?
A1: There could be several reasons:
- Biological Process: The cell population you're analyzing may be in a relatively steady-state system with no dramatic, directional state transitions. For example, a group of functionally mature and stable cells.
- Data Quality: The proportion of
unsplicedreads is too low or data noise is too high, which may lead to inaccurate RNA velocity estimation. - Parameter Selection: The selected cell types indeed have no direct differentiation relationship.
- Gene Filtering: Too few genes used for velocity calculation to provide sufficiently strong directional signals.
Q2: Is the "Latent Time" inferred by scVelo real cell differentiation time?
A2: No. Latent Time is a relative, rank-ordered measure. It reflects the position of cells in their transcriptional dynamic trajectory and can be understood as "pseudotime" or "biological clock." It is not directly equivalent to real physical time (hours, days), but its changing trend is positively correlated with real time. For example, cells with Latent Time of 0.8 are indeed closer to the differentiation endpoint than those with 0.2.
Q3: What are the differences between scVelo and Monocle, two pseudotime analysis tools? How should I choose?
A3: That's a good question; they each have their focuses:
- Monocle (2/3): Primarily constructs trajectories based on transcriptional similarity between cells. It sorts cells by "learning" a path through the cell population. It excels at mapping a differentiation process that has already occurred, but cannot inherently determine start and end points, often requiring users to specify based on prior knowledge.
- scVelo: Infers the future state direction of each cell based on RNA splicing dynamics. Its advantage is the ability to unsupervisedly and directionally predict trajectories, directly telling you "where cells are going."
- How to Choose:
- If you want to predict cell differentiation direction, find fate decision points, study cyclic processes, or if the start and end points in your system are unclear, scVelo is the first choice.
- If you're more concerned with identifying different differentiation stages (States), finding genes differentially expressed along trajectories, and have prior knowledge of the general direction of differentiation, Monocle is a very powerful tool.
- Best Practice: Use both in combination. For example, use scVelo to determine the general direction of trajectories and key driver genes, then use Monocle for more precise stage division and differential gene analysis of that trajectory.
Q4: How are the Top driver genes in the report calculated?
A4: These genes are ranked based on their likelihood in the scVelo dynamic model. A higher likelihood value for a gene means its spliced/unspliced expression pattern better fits the dynamic transcription process (upregulation, downregulation, steady state) described by the model. Therefore, these high-likelihood genes are considered the most clear and key genes in terms of transcriptional regulation during cell state transitions, i.e., "driver genes."
References
- La Manno, G., Soldatov, R., Zeira, A., et al. (2018). RNA velocity of single cells. Nature, 560(7719), 494-498.
- Bergen, V., Lange, M., Peidli, S., et al. (2020). Generalizing RNA velocity to transient cell states through dynamical modeling. Nature Biotechnology, 38(12), 1408-1414.
- Li, T., et al. (2020). On the Mathematics of RNA Velocity I: Theoretical Analysis. bioRxiv.
- Qiu X, Zhang Y, Yang D, et al. (2021). Mapping vector field of single cells. Biorxiv.
- Sunadome, K., et al. (2023). Directionality of developing skeletal muscles is set by mechanical forces. Nature Communications, 14(1), 3060.